
The Top 10 ABA Metrics
Powered by PlaidCloud's AI-ABA Executive Insight
Elevating care and increasing operational efficiency is easy when you let PlaidCloud's AI-enabled platform fuse your practice management, scheduling, billing, authorizations, payroll, and your general ledger, giving you a 360-degree view of your business. You'll get insight as fast as you can type or speak your query.
Think about what you can do with all the time you'll save and the insight you'll have.
- 01
True cost per billable hour
Fully loaded payroll cost (wages, employer taxes, reimbursements) allocated onto billed service hours by provider, role, and clinic.
- 02
Utilization % vs role targets
Billable hours vs paid hours per RBT and BCBA, scored against configurable per-role targets, with new-hire ramp handled.
- 03
Authorized vs delivered hours
The unused-authorization revenue gap by role, client, and week: hours payors approved that never became sessions.
- 04
Revenue at risk: unconverted notes
Dollars sitting in sessions whose notes haven't converted to billable entries, aged over 24 hours and over 7 days.
- 05
Cancelled hours by cause
Family vs staff vs center/weather buckets, plus no-show hours and make-up hours completed.
- 06
AR days & collection %
Revenue-cycle health shown beside operations instead of buried in a separate billing silo.
- 07
Staffing coverage ratios
Kiddos per BCBA, RBTs per BCBA, and the share of clients with an assigned BCBA or RBT.
- 08
Time to start
Days from accepted referral to first session: the intake-velocity number every multi-site operator chases.
- 09
Referral conversion by source
Word of mouth, physician and agency, internet, social, walk-in, and employee referrals against targets, with conversion to active clients.
- 10
Sessions without valid auth
Compliance and denial-risk exposure caught weekly, instead of surfacing months later as claim denials.
See it running on your desk in less than 1/2 a day* for free!
Contact us at Info@PlaidCloud.com and request your free AI-ABA Powered Executive Dashboard to get started. We look forward to helping you elevate your level of care and improve your overall operational efficiencies.
*System credentials required
Everything you capture
The full metric inventory, by theme
Grouped the way a multi-site operator runs the practice, and tracked against an explicit benchmark or target wherever one exists.
Client census & growthCensus / Business Development / Intake Funnel
- Beginning / new / discharged / ending census
A clean roll-forward of clients per market, the view boards ask for every month.
- Referrals by source vs target
Six named channels tracked against goals, so marketing spend is accountable.
- Referral conversion %
Auto-calculated from referral to active client. The intake-team scorecard.
- Good-fit waitlist depth
Demand backlog: the growth story payors and diligence both want to see.
- Time to start
Accepted-to-first-session days. Faster starts mean earlier revenue and better outcomes.
- Intake document collection stages
DX docs, ABA docs, and diagnostic outreach tracked as funnel steps, so stalls are visible.
Authorization management
- Auths submitted / pending / approved
The pipeline that gates all ABA revenue, visible as a funnel.
- Authorized hours by role
The BCBA vs RBT/Tech split of approved hours, at a glance.
- Target authorized hours per client
A per-kiddo benchmark is built in, so under-authorization shows immediately.
- Sessions held without valid auth
Every one is a denial or clawback waiting to happen. A weekly catch, not a year-end surprise.
Capacity, staffing & recruitingStaffing Coverage / Recruiting Velocity
- Authorized hours / available staff hours
The single capacity ratio: do you have the staff to deliver what payors approved?
- Kiddos per BCBA, RBTs per BCBA
Caseload ratios that drive both quality and burnout, rarely seen live.
- % kiddos with assigned BCBA / RBT
Unassigned clients equal undelivered authorized hours.
- Schedule fill rate
How much of the possible schedule is actually booked, auto-computed.
- Days a position stays open; offer decline %
Recruiting velocity for RBTs and BCBAs, tied to the capacity it constrains.
Schedule integrityExecutive Dashboard / Funnel
- Cancelled hours by cause bucket
Family vs staff vs center/weather. Each cause has a different fix; most operators only see a total.
- No-show hours & make-up hours completed
Lost hours, and how many were recovered.
- Appointment-to-timesheet conversion
Treatment delivered vs not, per session. The schedule you keep is the revenue you bill.
- 4-week trailing appointment hours
Per client and provider, so drops in service intensity get flagged early.
Utilization & workforce economicsPayroll & Utilization
- Utilization % vs per-role targets
Billable share of paid hours against role-specific goals. Labor is 70%+ of ABA cost.
- Cost per billable hour
Fully loaded cost (wages, taxes, reimbursements) per delivered hour by provider, role, and clinic.
- Payroll hours allocated to billed hours
Actual pay-period payroll mapped onto individual service lines. This is the hard part, done.
- New-hire ramp handling
New employees flagged so utilization scores stay fair and comparable.
- Direct labor cost by clinic / role / entity
Multi-entity, multi-clinic cost rollups from real payroll, not estimates.
Revenue & RCMRevenue Analysis / Quality & Risk
- Revenue, AR days, collection %
Revenue-cycle vitals in the same pane as operations.
- Billed vs paid on every service line
Line-level reconciliation of what was billed against what came back.
- Contracted vs standard rate variance by payor
Where agreed rates diverge from rate cards: payor-negotiation ammunition.
- Patient responsibility amounts
Family-owed balances surfaced beside payor balances.
- Revenue at risk from unconverted notes
An auto-computed leakage number that turns a documentation nag into a dollar figure.
Compliance & documentation
- % notes completed within 24 hours
The documentation SLA payors increasingly audit.
- Unconverted notes aged >24 hrs / >7 days
Aging buckets that make the backlog impossible to ignore.
- Same-day note completion count
A positive-behavior metric for clinical teams.
- Provider & client signature capture
Signature status on billing entries, ready as audit-defense evidence.
Executive accountability & drill paths
- Entity / state / region / clinic rollups
Every metric slices from consolidated down to a single clinic or provider.
- Leadership tags on every row
State, regional, and clinical directors attached to the data, so accountability is a filter, not a meeting.
- 4-week and 8-week trend windows
Purpose-built executive and efficiency views, not one overloaded page.
- Data freshness stamp
The last-refreshed date shown on the dashboard. Trust is a feature.
What ships
The dashboards you get
Seven purpose-built views, each drilling from the whole organization down to a single clinic, provider, or client.
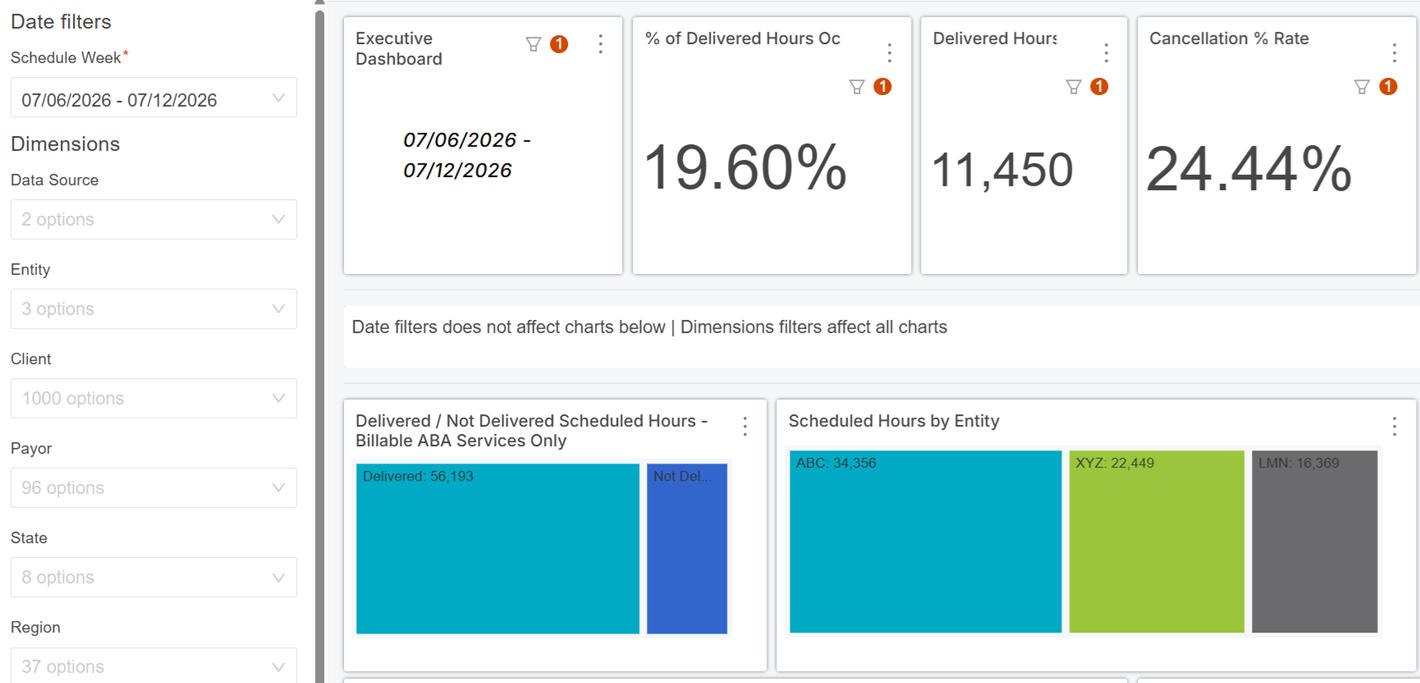
Executive Dashboard (4 weeks)
Appointments, cancellations, treatment delivered, leadership rollups
KPI Report
A cross-domain summary of the KPIs that matter most
Capacity
Staff capacity measured against authorized demand
Utilization: Hours
Billable-hour utilization against per-role targets
Operational Efficiency (8 weeks)
A trend view of the core efficiency metrics
Market Operational Funnel
The referral-to-revenue funnel, every step against a benchmark
Revenue Analysis
Revenue, billed vs paid, and payor-rate variance
Questions ABA Leaders Ask
What can I measure that CentralReach does not show on its own?
The metrics that only appear once practice, payroll, and general-ledger data are joined: true cost per billable hour, utilization against per-role targets, authorized vs delivered hours, revenue at risk from unconverted notes, and caseload coverage ratios. CentralReach is the source; PlaidCloud is where it meets your payroll and GL.
Do the dashboards run on our real data?
Yes. Every metric is computed from your CentralReach, payroll, and general-ledger data, refreshed on a schedule, and each one drills from consolidated all the way down to a single clinic, provider, or client.
Can I see each metric against a target?
Yes. Targets are first-class data, so actual-vs-goal is built in: per-role utilization targets, an authorized-hours-per-client benchmark, and referral goals by source all ship with the dashboards.
How fast can we go live?
The dashboards are pre-built and plug-and-play with CentralReach, so many ABA organizations go live in under 48 hours, with no spreadsheets to maintain afterward.
For ABA Leaders
ABA Insights & Resources





See These Metrics on Your Own Data
Bring your CentralReach, payroll, and general-ledger data. We will show you true cost per billable hour, utilization, and revenue at risk for your practices, live in a working demo.